


- February 1, 2023
- Posted by: Sachin Shrinivasrao
- Category: Application Engineering

Business owners expect their applications to be highly available with zero downtime, for example, Banking and trading platforms, which deal with multicurrency transactions, to be available 24/7. Realtime monitoring is essential for maintaining 100% uptime and ensuring RPO.
Organizations want surveillance solutions that can monitor and publish data as it is processed.
Payment gateways are used to authenticate financial transactions and to publish the success/failure status after they have been completed. A transaction status is required for EOD billing.
Establishing centralised monitoring and alerting mechanisms necessitates a thorough examination of application and system level logs. If an incident occurs, all parties involved will be notified via message/email/dashboard so that the affected teams can respond immediately.
This article will go over the log aggregation process for containerized applications running in a Kubernetes cluster.
Business Case
One of our clients approached Indium for improved visibility of their log aggregation and System Metrics visualisation. The client has over 100 applications running in a variety of environments. As a result, proactive monitoring and maintaining 100% uptime of business-critical applications became nearly impossible. They also had to manually search through multiple text filters for CloudWatch metrics. This was a time-consuming and labour-intensive process. There was also the possibility of avoiding outages that could result in SLA violations.
As a result, the customer’s top priority was to monitor these business applications centrally and effectively.
On the market, there are numerous surveillance options. Traditionally, the NOC team performs monitoring and incident response. In such cases, human intervention is required, and there is a risk of missing an incident or responding too slowly. For automated monitoring mechanisms, the ELK stack is frequently used. This saves time and money by reducing manual intervention.
The ELK Stack assists users by providing a powerful platform that collects and processes data from multiple data sources, stores that data in a centralised data store that can scale as data grows, and provides a set of tools for data analysis. All of the aforementioned issues, as well as operating system logs, NGINX, IIS server logs for web traffic analysis, application logs, and AWS logs, can be monitored by a log management platform (Amazon web services).
To know more about Indium’s AWS practice and how we can help you
Click Here
Log management enables DevOps engineers and system administrators to make more informed business decisions. As a result, log analysis using Elastic Stack or similar tools is critical.
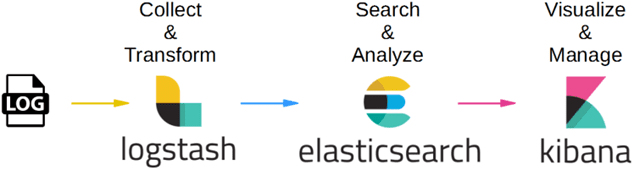
The diagram below depicts the ELK stack workflow and log flow transmission.
Business Need & Solution delivered
- The client lacked a warning system to prevent the application from failing. The ELK server recently crashed due to heavy load, and the affected team was unaware of the incident for three days.
- This mechanism for ELK server and application alerts was proposed and implemented by the Indium team.
- To avoid future failures, we wrote our serverless computing code in Python and deployed it to our customer’s infrastructure via AWS Lambda functions.
- When a pod in the Kubernetes cluster fails, the event trigger will be triggered.
The Lambda function monitors health and notifies affected teams via email. We also offered the solution in the form of an email notification of Kubernetes pod resource utilisation, such as CPU, memory, and network utilisation. Elasticsearch DSL queries and metric thresholds were used to configure these notification emails. If any of these system resources become unavailable, the client will be notified via email. The Indium team used the ELK stack to deploy a centralised monitoring solution. We created a dashboard for each environment that displays the metrics that are being used.
You might be interested in: AWS Lambda to Extend and Scale Your SaaS Application
Below is an example of how the metrics utilization is being captured and notified.
- Created the alert name in the Elasticsearch for e.g. [metrics-prod-CPU Utilization]
- Set Trigger event for every 1 minute
- Configured the conditions:
WHEN Max OF valu.max is above 90%.
- Added Filters as mentioned below:
metric_name.Keyword: “CPUUtilization” and namespace.keyword: “AWS/EC2”.
- Created a group alert
- _index
- InstanceID
- Metric_name
- Region. Keyword
- Created Email Connector: [Connector Name]
- Configured Sender email. Alerts will be sent using this DL
- Added service – Outlook
- Host Name
- Port: 25
- Created the Alert subject as [ALERT]: [PROD]: High CPU usage detected!!
- Below Conditions will be checked to display along with alerts:
– {{alertName}}
– {{context.group}} is in a state of {{context.alertState}}
– Reason: {{context.reason}}
– Routed the ELK link of the corresponding dashboard.
We have also used the Elasticserach query DSL for alerts configuration as below mentioned.
- Created the alert name for e.g. [metrics-dev-CPUUtilization].
- Set Trigger event for every 1 minute.
- Select the index metrics_dev and set size as 100.
- Query to capture data for required metrics:
{
“query”:
{
“bool”: {
“filter”: [
{“match_phrase”: {“namespace: “AWS/EC2”}},
{“match_phrase”: {“metric_name”: “CPUUtilization”}},
{“range”: {“value.max”: {“gte”:90}}}]
}
}
}
- Configured the conditional statements
- If the metrics utilization is above 90%
- If the utilization persists more than 5 minutes
- If both conditions are satisfied it will send an alert email
- Added the [Connector Name] in Actions [created before]
- Run when – QUERY MATCHED
- Configured the Email Recipients to receive the alerts notification
- Created the Alert subject as [ALERT]: [DEV]: High CPU usage detected!!
- Added below Conditions to display along with alerts:
- {{alert Name}}
- {{context.group}} is in a state of {{context.alertState}}
- Reason: {{context.reason}}
- Routed ELK link of the corresponding dashboard
We successfully configured all of the dashboards, and our customers are using them for real-time monitoring. The Indium team accomplished this in a short period of time, namely four months. Benefits of the solution include lower costs and less manual labour.
If you want more information or want to know how we do it, contact us. We are here to assist you.
Benefits
The customer benefits from the use of the centralised notification method. Here are a few standouts.
- The customer now has a Centralized Monitoring Dashboard through which they can receive resource utilisation and incident notifications via email.
- 75% less manual effort than the previous method of refreshing the Cloud Watch console every few minutes to see the logs.
- With the Kibana dashboards in place, this centralized dashboard provided a unified view of logs collected from multiple sources.
- The TAT and MTTR (Meantime to resolve) for incident resolutions have been reduced as a result of this.
- Opensource Stack was used entirely to create a low-cost monitoring solution.