


- May 17, 2023
- Posted by: Abdul Rafey Khan
- Category: Data & Analytics

Data wrangling plays a critical role in machine learning. It refers to the process of cleaning, transforming, and preparing raw data for analysis, with the goal of ensuring that the data used in a machine learning model is accurate, consistent, and error-free.
Data wrangling can be a time-consuming and labour-intensive process, but it is necessary for achieving reliable and accurate results. In this blog post, we’ll explore various techniques and tools that are commonly used in data wrangling to prepare data for machine learning models.
- Data integration: Data integration involves combining data from multiple sources to define a unified dataset. This may involve merging data from different databases, cleaning and transforming data from different sources, and removing irrelevant data. The goal of data integration is to create a comprehensive dataset that can be used to train machine learning models.
- Data visualization : Data visualization is the process of creating visual representations of the data. This may include scatter plots, histograms, and heat maps. The goal of data visualization is to provide insights into the data and identify patterns that can be used to improve machine learning models.
- Data cleaning: Data cleaning is the process of identifying and correcting errors, inconsistencies, and inaccuracies in the data. This step includes removing duplicate values, filling in missing values, correcting spelling errors, and removing duplicate rows. The objective of data cleaning is to ensure that the data is accurate, complete, and consistent.
- Data reduction: Data reduction is the process of reducing the amount of data used in a machine learning model. This may involve removing redundant data, removing irrelevant data, and sampling the data. The goal of data reduction is to reduce the computational requirements of the model and improve its accuracy.
- Data transformation: Data transformation involves converting the data into a format that is more suitable for analysis. This may include converting categorical data into numerical data, normalizing the data, and scaling the data. The goal of data transformation is to make the data more accessible for machine learning algorithms and to improve the accuracy of the models.
Also check out this blog on Explainable Artificial Intelligence for a more ethical AI process.
Let’s look into some code:
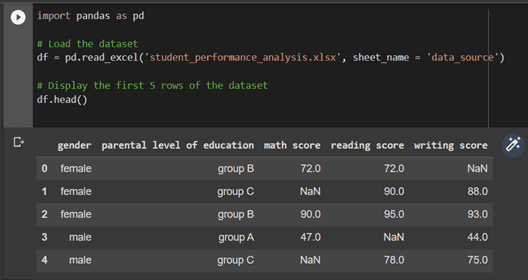
Here we are taking a student performance dataset with the following features:
- gender
- parental level of education
- math score
- reading score
- writing score
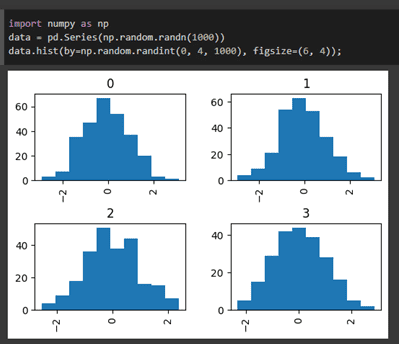
For data visualisation, you can use various tools such as Seaborn, Matplotlib, Grafana, Google Charts, and many others to visualise the data.
Let us demonstrate a simple histogram for a series of data using the NumPy library.
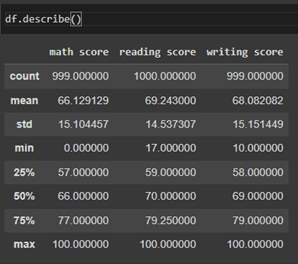
Pandas is a widely-used library for data analysis in Python, and it provides several built-in methods to perform exploratory data analysis on data frames. These methods can be used to gain insights about the data in the data frame. Some of the commonly used methods are:
df.descibe(), df.info(), df.mean() , df.quantile() , df.count()
(- df is pandas dataframe)
Let’s see df.descibe(), This method generates a statistical summary of the numerical columns in the data frame. It provides information such as count, mean, standard deviation, minimum, maximum, and percentile values.

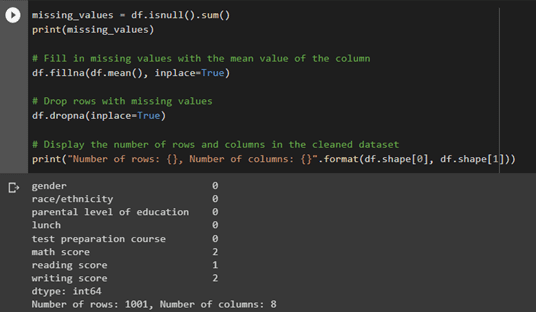
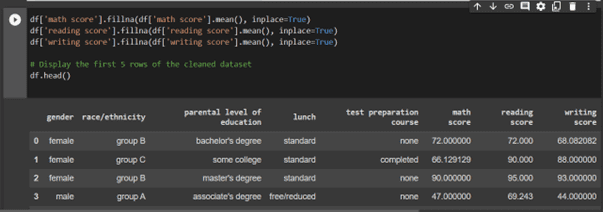
For data cleaning, we can use the fillna() method from Pandas to fill in missing values in a data frame. This method replaces all NaN (Not a Number) values in the data frame with a specified value. We can choose the value to replace the NaN values with, either a single value or a value computed based on the data.
For Data reduction we can do Sampling, Filtering, Aggregation, Data compression.
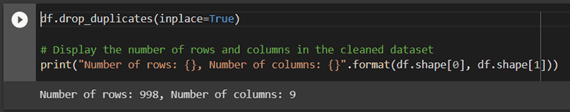
In the example below, we are removing the duplicate rows from the pandas drop_duplicates() method.
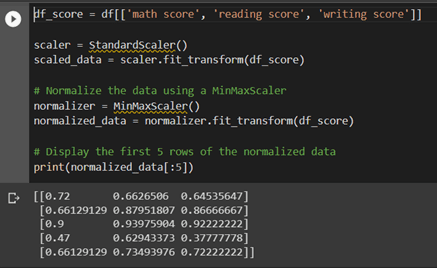
We will examine data normalisation and aggregation for data transformation; we are scaling the data to ensure that it has a consistent scale across all variables. Typical normalisation methods include z-score scaling and min-max scaling.
Here, we’re using a StandardScaler to scale the data.
Use the fillna () method in the Python pandas library to fill in missing or NaN (Not a Number) values in a Data Frame or a Series by using the mean value of the column.
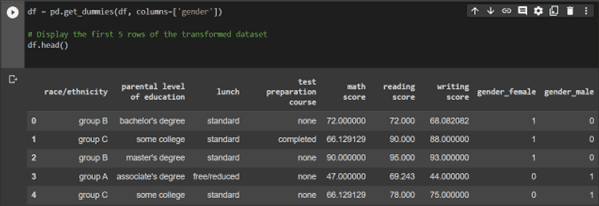
Transform the categorical data in the ‘gender’ column into numerical data using one hot encoding. We will use get_dummies(), a method in the Pandas library of Python used to convert categorical variables into dummy or indicator variables.
Optimize your data for analysis and gain valuable insights with our advanced data wrangling services. Start streamlining your data processes today!
Click here
In conclusion, data wrangling is an essential step in the machine learning process. It involves cleaning, transforming, and preparing raw data for analysis to ensure that the data used in a machine learning model is accurate, consistent, and error-free. By utilising the techniques and tools discussed in this blog post, data scientists can prepare high-quality data sets that can be used to train accurate and reliable machine learning models.