


- December 1, 2022
- Posted by: Ayush Panwar
- Category: Data & Analytics

With unparalleled advances in risk analytics and risk management, it is time for organizations to capitalize on and capture opportunities from their data.
In the advanced era of the computing world and its new analytical techniques, numerous organizations have extracted a deeper level of information from their voluminous data. They can do it rapidly by automating several essential operations. Risk departments have been using data analytics for decades, and these trends give them a unique chance to find, measure, and reduce risk more effectively. They could use their extensive data and analytics knowledge to help the C-suite define the strategic goal.
A component of risk management, risk analysis is not a brand-new idea. It has long been one of the responsibilities of leaders. What is novel, though, is how well-recognized it is becoming. As the regulatory and economic environments get increasingly complex, news stories are full of examples of what happens to organizations when risks aren’t managed well. As a result, risk analysis is at the top of the executive team’s agenda.
Risk management can get harder as an organization grows internationally because there are so many people, tasks, resources, deliverables, and information to keep track of. Since many vulnerabilities are not immediately apparent, designing and implementing effective risk management methods can be challenging. Executives are challenged to support their intuition with factual data, recognize potential dangers before they materialize, and identify future risks to evaluate important risk variables and understand how they relate to actual numbers.
Thanks to the recent advancements in computing power, organizations can now use complex analytical approaches on a small scale. At the top of the risk-analytics department, machine learning techniques like deep learning, Hebbian, random forest, and Kohonen are now widely used. Advanced technologies vastly improve the decision models of organizations. Additionally, geospatial analysis and neutral-language processing broaden the database from which businesses can draw conclusions.
Because of these changes, organizations are now able to automate boring tasks like collecting and cleaning data. Most data can be processed directly with the help of automation, and reports can be generated in almost real time. Because of this, risk teams can evaluate and reduce risk more quickly and accurately.
When to Use Risk Analysis?
There are various scenarios where risk analysis comes in handy, some of which include the following:
- Project scoping: Assessing risk before project completion can help you foresee risks and respond successfully.
- Choosing a business strategy: Conducting a risk analysis can help you gain critical insight into the benefits and drawbacks of several business strategies and help with selecting one that is ideal for your corporation.
- Upgrading safety: Risk assessment can be a crucial determinant of which reaction plans will best secure the safety of your staff and organization when it comes to enhancing safety standards.
- Preparing for uncertainty: By using risk analysis, you can better understand how to prepare for and react to unforeseen events like technological failures, natural disasters, or security breaches.
- Change of plans: Risk analysis can help you identify which changes are most likely to be successful in new legislation or the presence of new rivals.
Types of Risk Analysis
Any business venture now involves some risk. We should do this analysis based on how often it happens and update it whenever a possible threat shows up. This method can reduce the likelihood of future risks and possible damage. Currently, risk analysis can be divided into two groups:
1. Quantitative risk analysis
In this case, a risk model is constructed using the simulation method. Deterministic statistics can also be applied to assign the risk its numeral values. Most of the time, the random variables given by the risk model are the inputs at this point. The model will then produce a variety of outputs in relation to the inputs. For example, the *Monte Carlo simulation can be used to make a list of possible outcomes or inputs. Graphs and different scenario analyses are then utilized to analyze the model, and the final choice is made in light of this information.
2. Qualitative risk analysis
A numerical or quantitative rating is not a good way to figure out a qualitative risk analysis as an analytical method. Instead, a written list of uncertainties is required for qualitative investigation. An assessment of this risk’s potential impact is then completed. Furthermore, strategies for countermeasures are assessed in the event of unfavorable occurrences.
A useful method for simulating the results of random processes is defined as Monte Carlo simulation. We can generate statistics for hypothetical events using the technique. We can use the results of a betting game or stock trading to predict whether we will win or lose. By supplying random values with the right probability distribution, Monte Carlo can be used to create probability distributions for complicated functions.
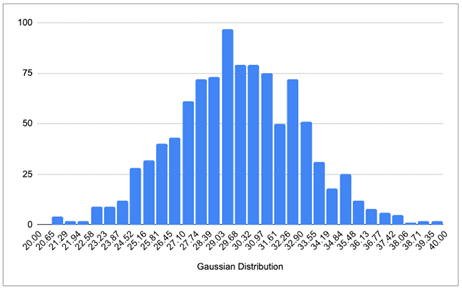
For example, three parameters—permeability, width, and area—are input into a pool storage model. Measurements made on-site indicate that the width is 10 meters +/-2 meters, the area is 50,000 square meters, and the permeability is Gaussian distributed with a mean of 30% +/-3% standard deviation. Find the uncertainty in total storage volume when the volume can be defined as area x width x permeability.
Solving the problem using Monte Carlo simulation:
We must create random numbers from a Gaussian distribution with the correct mean and standard deviation to represent permeability and mimic the results. We shall assume a uniform distribution between 8 and 12 meters thick since width does not specify a distribution. We select several random values from these two distributions to conduct the experiment and compute the resulting storage. The mean and standard deviation of the results can then be used to finalize our findings, or we can create a histogram to represent the findings.
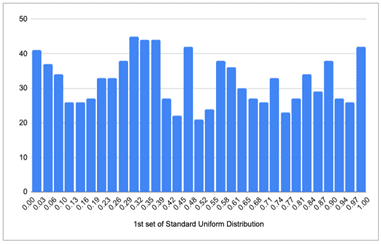
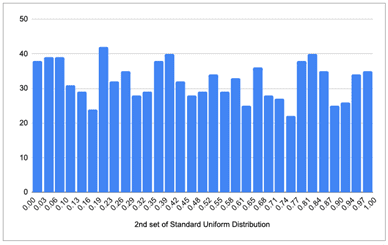
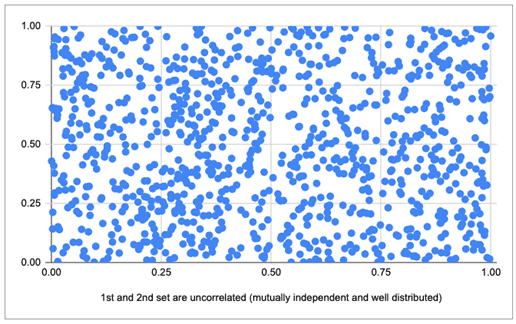
Step 1: Create two random sets of 1,000 numbers between 0 and 1 with a standard uniform distribution. As a sanity check, we make sure that these two sets of variables are not related to each other and are independent. Note: the variations from uniform are just due to the sample size. We would get a more uniform distribution when considering larger sets like 10,000 or 100,000.

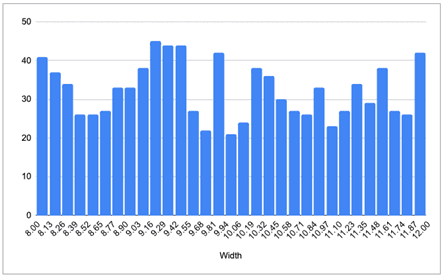
Step 2: Now we calculate the uniform distribution that we need, ranging between 8 and 12, for calculating the width using the first set of uniform distributions.
Step 3: We now take our second set of uniform distributions (as probabilities) and transform them into a Gaussian distribution with a mean of 30% and a standard deviation of 3%.Here, we get a perfect normal distribution using the CDF functionality.
Step 4: Now, we use the formula “permeability x width x area” to find out the total storage volume for each realization.
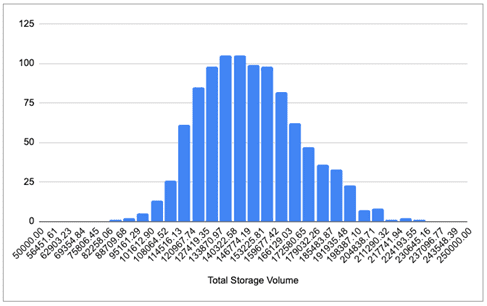 Our total storage volume distribution over an empirical histogram helps represent our outcome. From this chart, you can also answer various questions like the total production from the pool storage or calculate the probability of a volume less than or more than a hundred thousand, which can be done by counting the number of realizations that are greater than or less than a hundred thousand cubic meters.
Risk Analysis Methods
Several risk analysis techniques are available to assist managers in their analysis and decision-making. Some of these entail using risk analysis tools, including charts and written documentation. Let’s explore these risk analysis techniques and how they might be helpful to you.
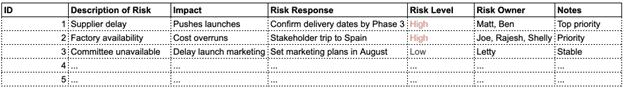
● Risk Register
A risk register is an essential project management tool for recording project risks. This document gives important details about all the possible risks that could happen during the project’s execution phase. It can be used as a part of the risk management plan to show who is in charge of the risks, how they can be reduced, and what resources are needed. A risk registry is typically created using various trustworthy data sources, including the project team, subject matter experts, and historical data.
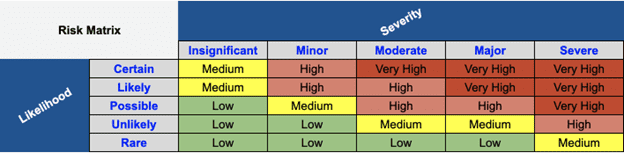
● Risk Analysis Matrix
The risk analysis matrix ranks risks according to relevance while determining their likelihood and severity. Its main objective is to help managers categorize risks and develop a risk management strategy to minimize them effectively using the necessary tools and tactics. This is a qualitative risk analysis technique since risk likelihood is quantified on a relative scale rather than a statistical one.
● SWIFT Analysis
A structured what-if technique, known as SWIFT, is a risk analysis technique that identifies potential risks connected to project plan modifications. As the name suggests, team members must come up with as many “what if” scenarios as they can to find all possible risks.
Risk Analysis Example
Let’s examine where and when risk analysis can be performed. The groups of the project management process say that risk analysis starts with planning and goes on for the whole project. As a result, we create our risk management strategy, identify the threats, and record them in our risk register.
The risk register thus serves as a reminder of all the risks, impacts, risk responses, and risk levels. Eventually, we need to consider the effect on activity resource estimates, activity duration estimates, schedules, cost estimates, budgets, quality, and even procurements.
Therefore, we extract those items from the risk register and perform the complete analysis in two steps. In the first section, we do a qualitative risk analysis, where we rank the risks based on how likely they are to happen and the severity of their consequences. This lowers the project’s overall risk uncertainty level and allows us to focus on the most important risk.
The second step is to do a quantitative risk analysis, which is a way to determine how certain risks will affect the project. That has the advantage of supporting decision-making and lowering project uncertainty. Again, this can help us plan our strategies for managing risks and limiting those risks.
Find out how to establish a risk mitigation strategy